SQL User Guide (Falcon)
CumuLogic DBaaS Platform
Welcome to the world’s most comprehensive Database-as-a-Service platform!
The CumuLogic DBaaS Platform is a software solution that provides a quick and easy way to access fully managed database instances on premise, on any Infrastructure-as-a-Service (IaaS) cloud or VM pool. Users can quickly launch a dedicated database service and optimize it for their particular workload if needed. CumuLogic platform manages the database instances from provisioning and monitoring; to replication, sharding and clustering; as well as backup/restore. Each database instance is optimized for a given size of the database node, so users get the highest price/performance value. Database instances can be scaled on-demand by adding new nodes without having to shutdown the database.
This guides provides you with step-by-step instructions for using the CumuLogic DBaaS Platform to easily deploy database environments. Please review the installation and administration guide for instructions on how to setup the CumuLogic controller as a prerequisite to this guide.
Terminology
- CumuLogic Controller – The CumuLogic DBaaS Platform’s orchestration engine, self service portal and automation platform.
- CumuLogic Agent – A software component embedded in any deployed service instance, used for control and monitoring telemetry into the deployed instances.
- Target Cloud – This refers to one or more Infrastructure-as-a-Service clouds such as Amazon EC2, Rackspace Cloud Servers, HP Cloud or any other OpenStack- or CloudStack-powered clouds.
- Services – Application infrastructure services such as databases.
- Service Instance – An instance of a service that has been deployed for a user. Service instances are any configuration of a service, from single node deployments through multi-node shard configurations.
- Parameter Groups – A set of configuration values, which can be modified by users for a given service instance to optimize that service instance for a specific type of application workload.
- Access Groups – Security or firewall configurations to control access to the service instance.
- Automated Backups – Backups of database instantiated by the platform, usually once in 24 hours for each running database instance.
- Failover – functionality of the platform to recover cloud service instances from any failures. This usually includes restarting a failed service or re-provisioning failed instances.
Supported Infrastructure Targets
CumuLogic’s DBaaS Platform is capable of deploying service instances on a number of infrastructure types. Infrastructure targets are referred to as “Target Clouds” within the CumuLogic controller. The controller can be configured to provision infrastructure on-demand using the APIs exposed by several popular Infrastructure-as-a-Service software systems, as well as a number of public cloud providers. The controller is also able to work with pools of pre-installed operating systems, which can be either installed on bare metal servers or be pre-created as virtual machines.
Currently supported IaaS software systems include:
- Apache CloudStack
- Citrix CloudPlatform
- Eucalyptus
- Nebula
- OpenStack
- VMware vCloud Director
The target clouds offered to users of the CumuLogic DBaaS platform are configured by the administrator of the controller, but are selectable by users when provisioning any new service instance.
Register and Log into CumuLogic Console
Whether you are using a hosted or private version of CumuLogic’s DBaaS platform, you need to register and activate your account. Register by clicking the “Register Now!” link on the login page.
Figure 1: CumuLogic Console Login Window
After registering, you will receive an email with a link to use to confirm your email and activate your account.
Dashboard
Your landing page is the CumuLogic Dashboard. The dashboard provides information about your deployed service instances, in progress service provisioning activities, and quick access to pre-configured subscription bundles for services.
Figure 2: CumuLogic Dashboard
From the dashboard, you can immediately launch a new service instance, based on any pre-configured subscription options that your administrator has published. You are also able to launch a new custom configuration of a service.
NOTE: You may be required to configure your API keys for target IaaS clouds prior to provisioning a service to that target cloud. Your administrator may have pre-configured these API keys on your behalf. Please see the Target Clouds section of this document for instructions for completing that task.
User Settings and Tools: Notification Center
In the upper right hand corner of the CumuLogic DBaaS Platform’s web interface, you are able to view the latest notifications for your account. These include service provisioning activities, account logins, and automatic events initiated by the controller on your behalf.
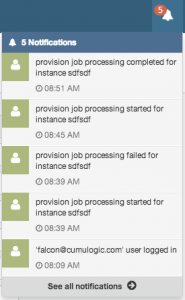
Figure 3: Notification Center
Click on the “See all notifications” link to review a full listing of notifications for your account.
User Settings and Tools: My Profile
The My Profile menu option provides access to screens that allow you to change your user information and to reset your password.
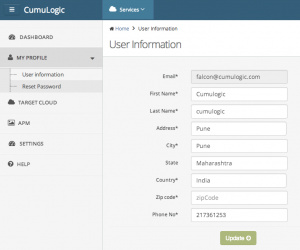
Figure 4: My Profile – User Information
The user information screen allows you to change your first and last name, address and phone number details. Your email address may not be changed, since it is the user ID you use to log into the CumuLogic controller.
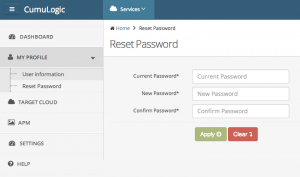
Figure 5: My Profile – Reset Password
The reset password screen allows you to change your profile’s password. It requires your current password, and entry of your new password two times.
User Settings and Tools: Target Clouds
CumuLogic’s platform allows you to deploy applications on multiple target Infrastructure-as-a-Service (IaaS) clouds to provision the applications. Target clouds can be one of the supported public clouds, including HP Cloud, Rackspace Cloud, Amazon EC2, Datapipe or any other clouds based on Apache CloudStack, Citrix CloudPlatform and OpenStack clouds. CumuLogic’s platform also supports VMware vCloud and vSphere environments.
This page allows you to review the currently available target clouds; as well as adding, editing and deleting targets.
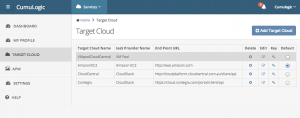
Figure 6: Target Clouds
To add a new target cloud, click the “Add Target Cloud” button. To edit or delete an existing target cloud, click the appropriate icon in the list.
You are able to select the target cloud that you want to be the default selection for new service instances on this screen as well.
Clicking on the “key” for any specific target cloud will give you access to a private key that you can use to SSH into any deployed service instance node (VM or bare metal server). SSH access requires that you have network connectivity and appropriate network ACL’s applied from your local system into the environment.
Adding a new target cloud is a two-step process:
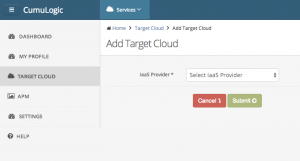
Figure 7: Add Target Cloud – Step 1
The first step is to select the IaaS provider. The administrator of the CumuLogic controller makes IaaS providers available to your user account.
The second step is to provide details for your account’s access to that target environment. These are the same fields available when updating / editing a target cloud:
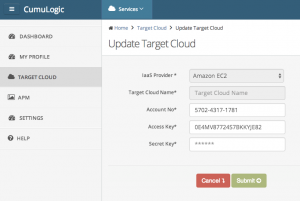
Figure 8: Add Target Cloud – Step 2
Target clouds require different information, depending on the specific type of environment. Generally, fields include:
- Target Cloud Name – the name that you want to use when referring to this target cloud
- Account No – the account number used for clouds like AWS
- Access Key – the API access key for the target cloud
- Secret Key – the API secret key for the target cloud
User Settings and Tools: APM
In addition to the build-in monitoring features, the CumuLogic DBaaS Platform allows you to automatically deploy and configure New Relic and AppDynamics monitoring services for each service instance you create.
The APM page allows you to configure your account specifics for these services:
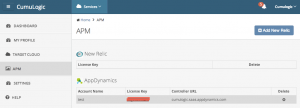
Figure 9: APM
User Settings and Tools: Settings – SQL Defaults
The SQL Defaults page allows you to configure certain service properties that you want to be defaulted each time you perform a custom service instance provisioning process. For more details on the meanings of these fields, please review the Creating a new SQL Cluster section of this document.
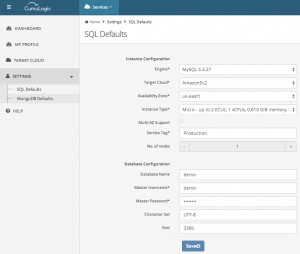
Figure 10: SQL Defaults
SQL Instances Overview Page
The SQL Instances Overview page gives you a listing of any deployed, in progress or terminated SQL service instances for your account.
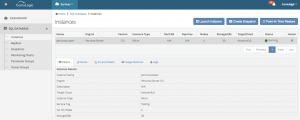
Figure 11: SQL Instances
From this page, users can launch a new instance, create a snapshot of an instance, and manage their instances. Several service management functions can be performed, based on the status of the instance, by clicking on the “Action” icon for that cluster.
Launching a SQL Instance
You can launch a SQL service instance (standalone or cluster) from the service dashboard or from the SQL Instances page by clicking on the “Launch Instance” button.
The process of launching an instance includes two pages of input from the user. The first page of the wizard asks the user to provide a number of configuration options related to the instance sizing, availability configuration and network configuration. That page also provides fields for initial database naming and configuration. The second page of the wizard provides options for selecting a parameter group, as well as establishing backup and maintenance policy.
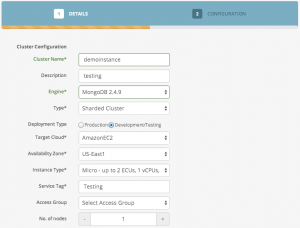
Figure 12: Launch SQL Instance – Page 1
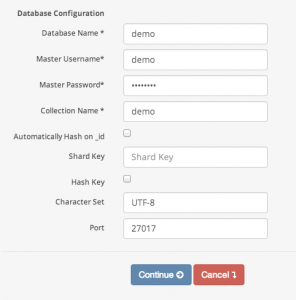
Figure 13: Launch SQL Instance – Page 2
Below is a description of each field in the wizard and the default values:
|
Once the database instance has been provisioned, you will be returned to the SQL instances listing page. To view progress of the provisioning process, click on the instance name and then select the “Events” tab.
Viewing SQL Cluster Details
Deployed SQL instances have five tabs worth of data for review. Each tab provides different information about the cluster.
Details Tab
The details tab for an instance provides a listing of the configuration parameters used to design the instance’s size, type, target cloud, and other values.
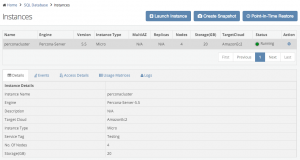
Figure 14: Details tab
Events Tab
The events tab provides a listing of all automation events performed for that instance, including the initial provisioning process, changes, and automatic tasks performed by the CumuLogic controller against the instance (such as performing a daily backup routine). The refresh button can be used to refresh the view, as a way to get the latest events (e.g.: during a multi-step process).
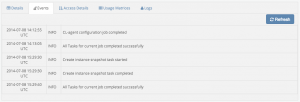
Figure 15: Events tab
Access Details Tab
The access details tab provides a listing of each component of the deployment. For a cluster, all nodes are listed.
Clicking on the Host Name field will display additional details about the IP addresses (internal and external) and hostnames provided by the target cloud.
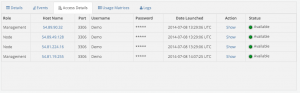
Figure 16: Access Details tab
Usage Matrices Tab
The usage matrices tab shows the available free space for the instance, as well as a breakdown of the data usage by database inside the instance (including data, index and total usage).
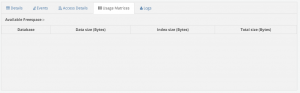
Figure 17: Usage Matrices tab
Logs Tab
The logs tab gives you access to the latest logs from each node in the instance. This is useful for debugging the configuration, or understanding how the environment is being used. This includes mysqld.log, slow-query.log and general-query.log.
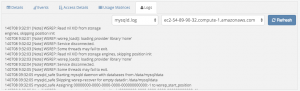
Figure 18: Logs tab
Actions to Modify SQL Instances
For any deployed SQL instance, there is a set of actions available to you for management of that instance. Clicking on the “Action” icon in the instance list will display this menu:
Figure 19: Instance actions
The actions available are:
- Terminate – This action will destroy all underlying nodes of the instance, but leave the definition of the cluster intact for future re-provisioning.
- Modify – This action will allow you to change aspects of the instance’s configuration, like its parameter group and backup rules.
- Restart – This action will initiate a restart of the services in the instance.
- Clone – This action will create a new version (clone) of the instance, by creating a shapshot of the instance prior to provisioning.
- Add Nodes – This action is only available for a Percona cluster. It will add a single node to the cluster.
- Remove Nodes – This action is only available for a Percona cluster. It will remove a single node from the cluster.
- Read Replica – This action is only available for a MySQL instance. It will create a read replica tied to the master instance.
Working with SQL Instance Replicas
Any MySQL instance can have additional read replicas created for it. Add read-replicas by clicking on the “Read Replica” action on the instance list page. The following dialog will appear:
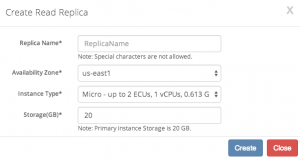
Figure 20: Create Read Replica
To add the read replica, provide a name, availability zone, instance type and storage.
Deployed SQL replicas can be found on the Replicas page:
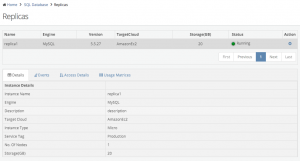
Figure 21: Replicas
Clicking on a deployed replica will show the same four tabs available for instances in the Instance list page: Details, Events, Access Details and Usage Matrices.
For any deployed SQL replica, there is a set of actions available to you for management of that replica. Clicking on the “Action” icon in the replica list will display this menu:
Figure 22: Replica actions
The actions available are:
- Promote Replica as Master – This action will terminate the replication job tying the replica to its master instance, and promote the replica to being a read-write master. The replica will no longer be visible on the Replica’s list, but will appear on the SQL instances list.
- Terminate – This action will destroy the underlying node of the replica, and cleanup the replication configuration on the master to remove this node.
Working with Snapshots
If you are planning to make any major schema or data changes to your running cluster, you may consider storing the latest snapshot. Snapshots are also performed automatically by the controller, if you selected backup serviced for the cluster in question.
All snapshots stored by the system are available on the Shapshots page:
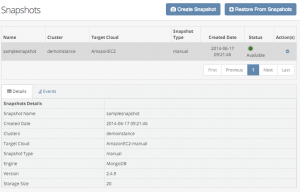
Figure 23: Snapshots
Actions available for any existing snapshot include “Restore Snapshot” and “Delete”.
Creating a Snapshot
From either the Clusters or Snapshots page, click the “Create Snapshot” button to manually create a new snapshot.
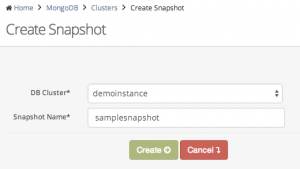
Figure 24: Create Snapshot dialog
After selecting the target cluster and providing a name for the snapshot, the system will perform a file-system based snapshot of the relevant nodes in the cluster. Each of these filesystem-based snapshots will be compressed and stored by the controller in the configured backup storage location (as setup by the administrator when the controller was installed). Application access to the database will not be affected by this process, however the CumuLogic controller will deny any management modifications to the cluster during both the snapshot and archival phases of the operation.
Restoring from Snapshot
Snapshots can be restored from either the top of the Snapshots page (by clicking on the “Restore From Snapshot” button) or from the actions menu of a snapshot.
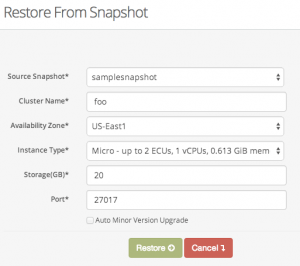
Figure 25: Restore from Snapshot dialog
Restoring from a snapshot will create a new version of the cluster, with the selected options.
Working with Parameter Groups
Parameter groups are a set of configuration and optimization parameters that CumuLogic database service exposes for users to modify to meet specific workload requirements. For instance, you may want to optimize Percona configuration values to tune your database for read-heavy workloads or increase the query cache size. If you are familiar with optimization techniques for databases, you can create your own Parameter Groups and change the values for specific parameters and apply them to any database instance.
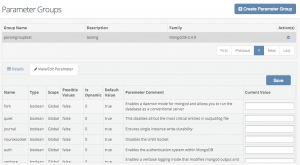
Figure 26: Parameter Groups
Working with Access Groups
Access groups such as Security Groups provide firewall-like functionality to secure database instances. By default, access to database instances via any protocol is blocked. In order to connect to the database instances, users can create and configure Access Groups to allow access from specific IP addresses or servers.
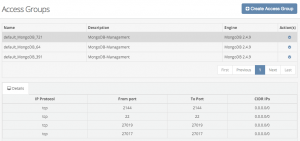
Figure 27: Access groups
In the example above, the Access Group called “default_Percona-Server_4944” is allowing access to the cluster from any IP address (0.0.0.0/0) on ports 3306 and 22.
Access Groups can be edited and applied to running database instances in real time without impacting database operations.
Monitoring Graphs
The Monitoring Graphs page provides performance reporting for all deployed clusters you have configured. When the page loads, you will need to select the cluster that you want to view data for.
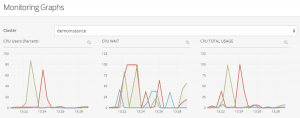
Figure 28: Monitoring graphs
Each metric can be expanded by clicking on the magnifying glass icon in the upper right corner of each small chard. Once expanded, you may select a different periods over which to chard the specific metric.
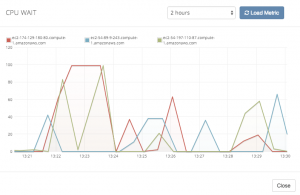
Figure 29: Monitoring graph expanded